| SUN UNIVERSITY |
| SCIENTIFICALLY INTRODUCING UNIVERSALITY TO THE UNIVERSITY |
Prof. Dr. med. Gunther Hildebrandt • Chronobiological Aspects of Music Physiology
The transparent harmonic order is, however, compared to the demand on functional performance very delicate, and constantly needs to be regenerated in peace and restfulness. This occurs mostly during sleep at night.
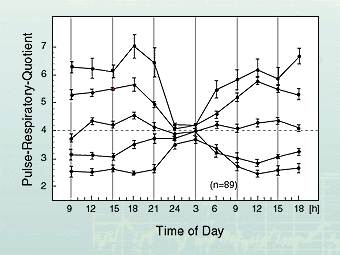
Illustration 11 e.g. shows average daily plot of the frequency ratio of heart and breathing rhythm in groups of healthy people under regular conditions of rest.
The normal whole numbered ratio of 4:1 (cf. illustration 10) is only seldom maintained the entire day, mostly there are great deviations in both directions, the size of which was here based on the group formation. During the night, however, after some hours of sleep, all curves converge in a very limited area, that of the whole numbered norm 4:1 (so called nightly normalization of the rhythmic functional order).

Illustration 11
Average daily plots of the pulse-breath-frequency quotient of a total of 89 healthy subjects who were divided into five groups according to the 24-hour average value of the quotient. The brackets describe the area of the average error of the average values. Note the nightly normalization between 12.00 and 3.00 a.m. which occurs independently from the direction of the deviation during the day.
(According to dates by PÖLLMANN 1991)